
Business Software
Custom Business Dashboards: Features, Architecture and Development Considerations
Discover when to transition from spreadsheets to custom business dashboards, key architectural layers, real-time KPI pipelines, role-based access control, and TCO.
On this page
Quick answer
A custom business dashboard is a bespoke web application engineered to consolidate fragmented operational data, track live company KPIs, manage approval workflows, and automate daily reporting within a unified interface.
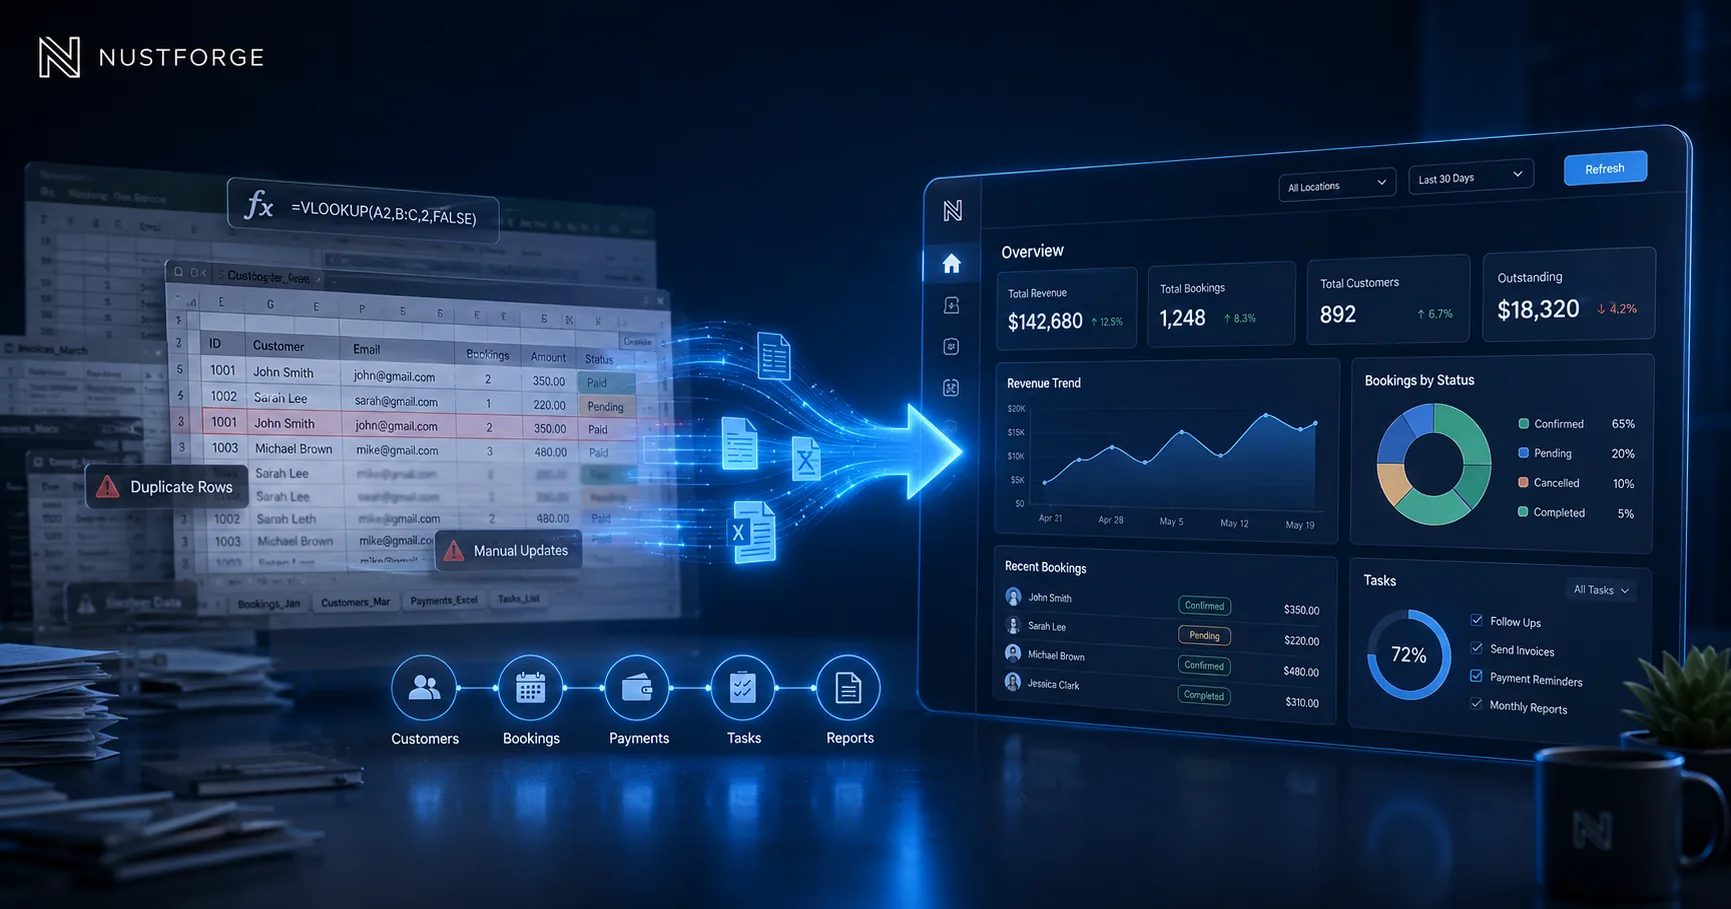
Businesses should transition from spreadsheets to custom dashboards when multiple team members edit files simultaneously, manual data copy-pasting takes hours each week, formula errors create financial risk, or third-party SaaS tools cannot support proprietary business logic.
Modern custom dashboards built on Next.js, TypeScript, Tailwind CSS, and PostgreSQL deliver sub-second data rendering, exact role-based permissions, and zero per-seat licensing fees compared to commercial BI tools.
The limits of spreadsheets and off-the-shelf BI tools
Spreadsheets like Excel and Google Sheets are versatile prototyping tools, but they inevitably break under operational scale. They lack granular row-level access control, concurrency locks, automated audit histories, and real-time integration with external APIs.
Off-the-shelf BI platforms (such as Tableau, PowerBI, or Retool) offer visual widgets, but frequently impose steep monthly per-seat licensing costs that penalize organizational growth. Furthermore, embedding write-back operational actions—such as approving invoices, dispatching jobs, or triggering client emails—within generic BI tools is clunky and error-prone.
A custom web dashboard gives your business complete intellectual property ownership, tailored operational workflows, custom database indexing, and a clean interface designed around how your staff actually work.
Core architectural tiers of a modern dashboard
A resilient business dashboard is structured across three core architectural tiers: 1) Data Ingestion and Transformation; 2) The Relational Datastore and API Layer; and 3) The Reactive Presentation Interface.
The ingestion tier utilizes background webhooks, scheduled cron workers, and streaming queues to collect data from payment processors (Stripe), CRMs, marketing platforms, and internal databases without slowing down user interactions.
The presentation tier uses Next.js React Server Components (RSC) to pre-render static navigational structures and executive summaries on the server, paired with lightweight client islands for interactive date range pickers, searchable data grids, and live chart updates.
Role-Based Access Control (RBAC) and data governance
Not all team members should see all business data. Executive directors need broad revenue visibility, departmental managers require operational throughput metrics, and external contractors should only access tasks assigned specifically to their account.
Robust RBAC architecture enforces permissions at both the UI level (hiding unpermitted navigation items and action buttons) and the serverless API route level (verifying JWT claims and database row ownership before executing queries).
Additionally, high-value business dashboards implement immutable audit logging: every critical action—such as status updates, price overrides, data exports, or employee record modifications—is recorded with a timestamp, user ID, and IP address for compliance and accountability.
Performance optimization for large datasets
Operational dashboards become sluggish when frontend components attempt to render thousands of raw table rows or run expensive unindexed aggregation queries across millions of database records.
Production performance requires server-side pagination, indexed database views, materialized summary tables for historical metrics, and intelligent caching headers (stale-while-revalidate).
On the client, data tables should leverage virtualized rendering (e.g., rendering only visible rows in the viewport) and debounced search inputs to ensure instantaneous UI response times regardless of total record count.
How NUSTFORGE delivers custom business dashboards
NUSTFORGE specializes in building high-speed, secure, custom business dashboards, admin portals, and internal tools for growing companies and digital enterprises.
Our dashboard builds feature modern Next.js App Router architecture, PostgreSQL schemas, granular role permissions, real-time status notifications, exportable audit reports, and seamless third-party API integrations.
We work closely with your operations leaders to map existing spreadsheets and workflows into an intuitive digital command center that eliminates manual friction and empowers data-driven decisions.
Continue reading
Related software guides.
Business Automation
When Should Your Business Move from Spreadsheets to a Dashboard?
Identify when spreadsheets cause data errors and slow down operations, and learn when a custom dashboard delivers the role permissions and visibility you need.
Read article
Data Migration & Systems
Excel to PostgreSQL Migration: A Practical Business Data Migration Guide
How to safely transition mission-critical business spreadsheets into normalized PostgreSQL relational databases: data profiling, schema design, ETL, validation, and rollback safety.
Read article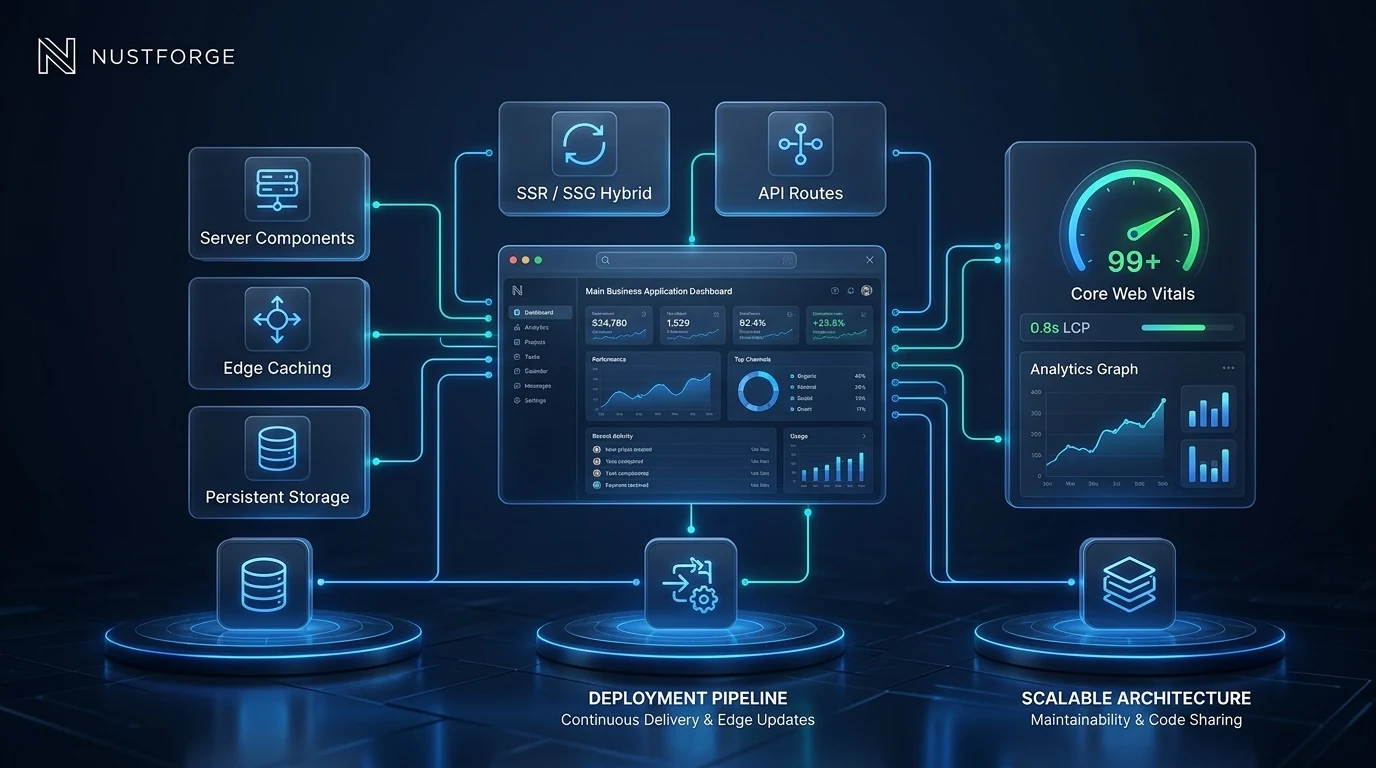
Custom Software Development
Next.js for Business Applications: Architecture, Performance and Maintainability
Explore why modern enterprises choose Next.js App Router for business portals: Server Components, streaming SSR, edge caching, Core Web Vitals, and type safety.
Read articleBuild your custom dashboard
Outgrowing spreadsheets and disconnected SaaS tools?
Let NUSTFORGE design a unified, high-performance operational dashboard tailored to your company's workflows.